data analysis
The results we found when completing this project are that the average area of lipid droplets when the oleic acid was added to the HeLa cells were significantly larger in area than both the lauric acid and ethanol only. The lauric acid qualitatively produced more lipid droplets than both oleic acid and ethanol only however, the lipid droplets had a smaller area than the oleic acid. Because ethanol only was a control group, the lipid droplets were smallest in size as expected. The figure below shows the two fatty acids and the control group compared to one another and shows the significant differences in area.
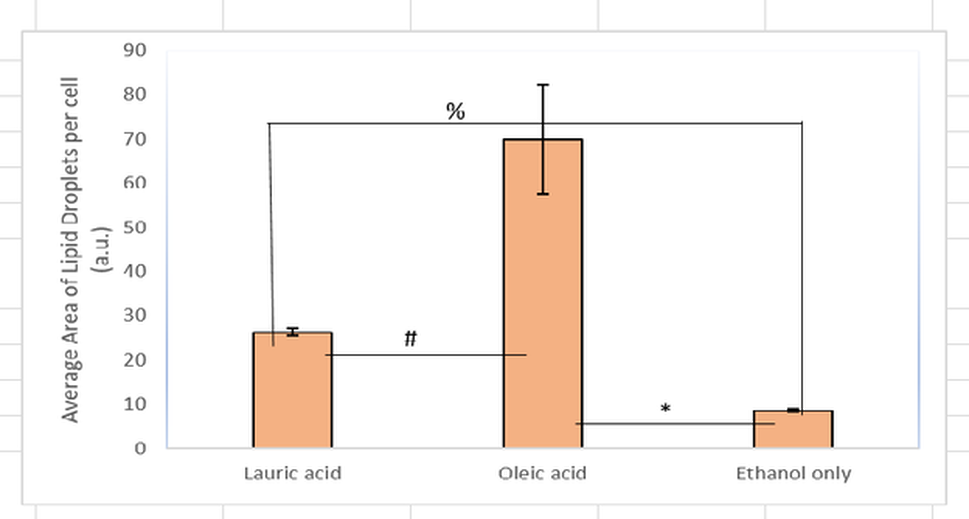
Figure legend: The p-value of lauric acid compared to the ethanol-only group was denoted by % (p=1.30673E-36). The p-value of oleic acid compared to the ethanol-only group was denoted by * (p=2.63288E-08). The p-value of lauric acid compared to the oleic acid was denoted by # (p=3.06212E-08). The unit symbol a.u. represents arbitrary units. The number of samples for the lauric acid group was 289 lipid droplets, for oleic acid 109 lipid droplets, and 148 lipid droplets for the ethanol-only group.
